Umlindi Information System
1 November 2001
South Africa's climate is characterised by severe spatial and temporal fluctuations in rainfall. This affects issues relating to food security, crop production and general agricultural economics. Policy and decision-makers are often required to respond to drought and other disasters without having sound scientific information available.
In the light of this, the ARC-Institute for Soil, Climate and Water has developed the Umlindi Information System in the form of a website. The system was developed with financial aid from the National Department of Agriculture and attempts to inform decision-makers of the current drought condition, fire risk and vegetation condition. Umlindi is the Zulu word for 'the watchman'.
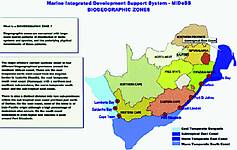
The Umlindi front page
This information is based on interpreted National Oceanic and Atmospheric Administration (NOAA) satellite and climate data. The data is processed in ESRI's ArcView 3.2 Spatial Analyst and Chips for Windows to derive the following four products. The procedures are fully automated with Avenue scripts.
* Fire: The sites where active fires occurred in a 10-day period. The active fires are derived from the mid-infrared band using Chips. The image derived from Chips for Windows is then displayed according to the required legend in ArcView and exported to the website. The ARC-Institute for Soil, Climate and Water is the southern African node for the World Fire Web. Active fires are detected on a daily basis and sent to an intern server that is available at www.gvm.sai.jrc.it
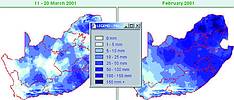
The rainfall page on the website
* Rainfall: Rainfall for a 10-day period interpolated between the available station data. ArcView Spatial Analyst is used to interpolate the rainfall with the following procedure:
* Calculate percentages by dividing the rainfall value with the long-term average for each station.
* Use inverse distance waiting (IDW) to interpolate these percentages.
* Multiply the percentage map with the long-term average map.
* Use inverse distance waiting (IDW) to interpolate these percentages.
* Multiply the percentage map with the long-term average map.
The long-term average rainfall surfaces are very accurate. Attributes such as altitude, slope, aspect, distance to sea, position in local terrain, rain shadow effects, etc were used to create these maps.
* Vegetation activity: Processed satellite image to show the vegetation activity. The normalised difference vegetation index (NDVI) images are derived from the red and mid-infrared bands of NOAA images using Chips. The image derived from Chips for Windows is then displayed according to the required legend with ArcView and exported to the website.
* Crop growth and drought: The water satisfaction index for a standard maize variety. It indicates whether this crop has received sufficient water over the season up to the present, or if it has suffered from insufficient water. The water satisfaction index is calculated with ArcView Spatial Analyst from evapo-transpiration and rainfall data.
Users of the website are required to select a province, date and type of query to allow the system to provide information accurately. The various types of queries comprise fire, rainfall, vegetation activity and crop growth and drought. Similar systems are planned for all SADC countries in the near future.
The system went operational in August 2000. There is a delay of five days to process the information for each ten-day period. All software was supplied by GIMS.
GIMS, (011) 315 0390
Others who read this also read these articles
An intelligent, integrated approach
MapIT has crafted a Licensed Partner programme based on the common requirement for highly accurate mapping data[ October 2004 ]
Picture it ...
MarketScope can calculate virtually any demographic scenario for your marketplace, taking into account a variety of factors, including your customer profiles, census information, competitor analysis data and any other set of business-related statistics you wish to evaluate, and visually display the results, arriving at an answer within 30 seconds[ August 2004 ]
Mondi develops advanced GIS business system
Mondi Forests has a truly integrated GIS business system that not only takes care of daily operational requirements, but also facilitates the use of GIS decision-making technology[ June 2003 ]
Implementation of a GIS system in local government
The most cost effective and user friendly way of implementing the MIS system and making it accessible to all authorised officials and Councillors throughout the Municipality was to build a Web application using Bentley Publisher[ April 2003 ]
GIS technology saluted for social and economic contributions
GIS is a powerful analytical tool that integrates spatial (or location) data with associated information, presenting the result in an easy-to-understand, map-based format[ February 2003 ]
ArcGIS Schematics launched
ArcGIS Schematics offers a high degree of flexibility and is not limited by the evolution of the data model and by changing database locations[ February 2003 ]
Building a locations-based service
Before we can start any project, we need to know and understand what the system is going to be used for[ August 2002 ]
Sustainable fisheries and marine conservation in Kenya
A Microsoft Access database is being developed to manage the data[ August 2002 ]
Others who read this also read these news items
Hikers, bikers and urban street pioneers
[ December 2005 ]
Image compression provides post-Katrina aerials within days
[ December 2005 ]
Navigation - the tip of the GIS iceberg
[ October 2005 ]
Fun and affordable in-car navigation
[ October 2005 ]
Cycling on the edge
[ October 2005 ]
Routing made easy
[ August 2005 ]
MapIT expands into West Africa
[ August 2005 ]
Incredible Connection powers navigation tools
[ August 2005 ]
Others who read this also read these regulars
ArcIMS 9.1 Route Server - routing and geocoding
[ October 2005 ]
Enterprise GIS with ArcGIS 9: a comprehensive GIS platform
[ October 2004 ]
GIS in Africa
[ August 2003 ]
Complete logistics and routing solution
[ August 2002 ]
ESRI offers highly integrated GIS solutions
[ April 2002 ]
GIS - the tool to help manage change in the 21st century
[ April/May 2000 ]
GIS software that sets a new standard
[ April/May 2000 ]
Search Site
Subscribe
Previous Issues
Other Technews Publications
Other Technews Buyers Guides
 |  | Copyright c1995-2009 Technews Publishing (Pty) Ltd.. All rights reserved. |